01 / INVENTORY
MCP inventory
Bring MCP services and their tools together in one place. See which agents use them and what changes.
See how agents use MCP, API and A2A services. Build an inventory of MCP services and tools, spot anomalies, investigate incidents and manage access.
research-agent→tools/call→internal-search
agent call→tool response→AI explanation
agent→access rule→allow / block
Connect the gateway
you already use.
Go from an inventory of MCP services and tools to understanding connections, anomalies and risks.
Bring MCP services and their tools together in one place. See which agents use them and what changes.
An incident flags an anomaly in an agent's interaction with an MCP, API or A2A service. Traces and AI Assistant help you understand why it happened.
Manage agents' access to services from one console. Your gateways apply those decisions.
OPENSEARCH SCREENS · TEST LAB DATA
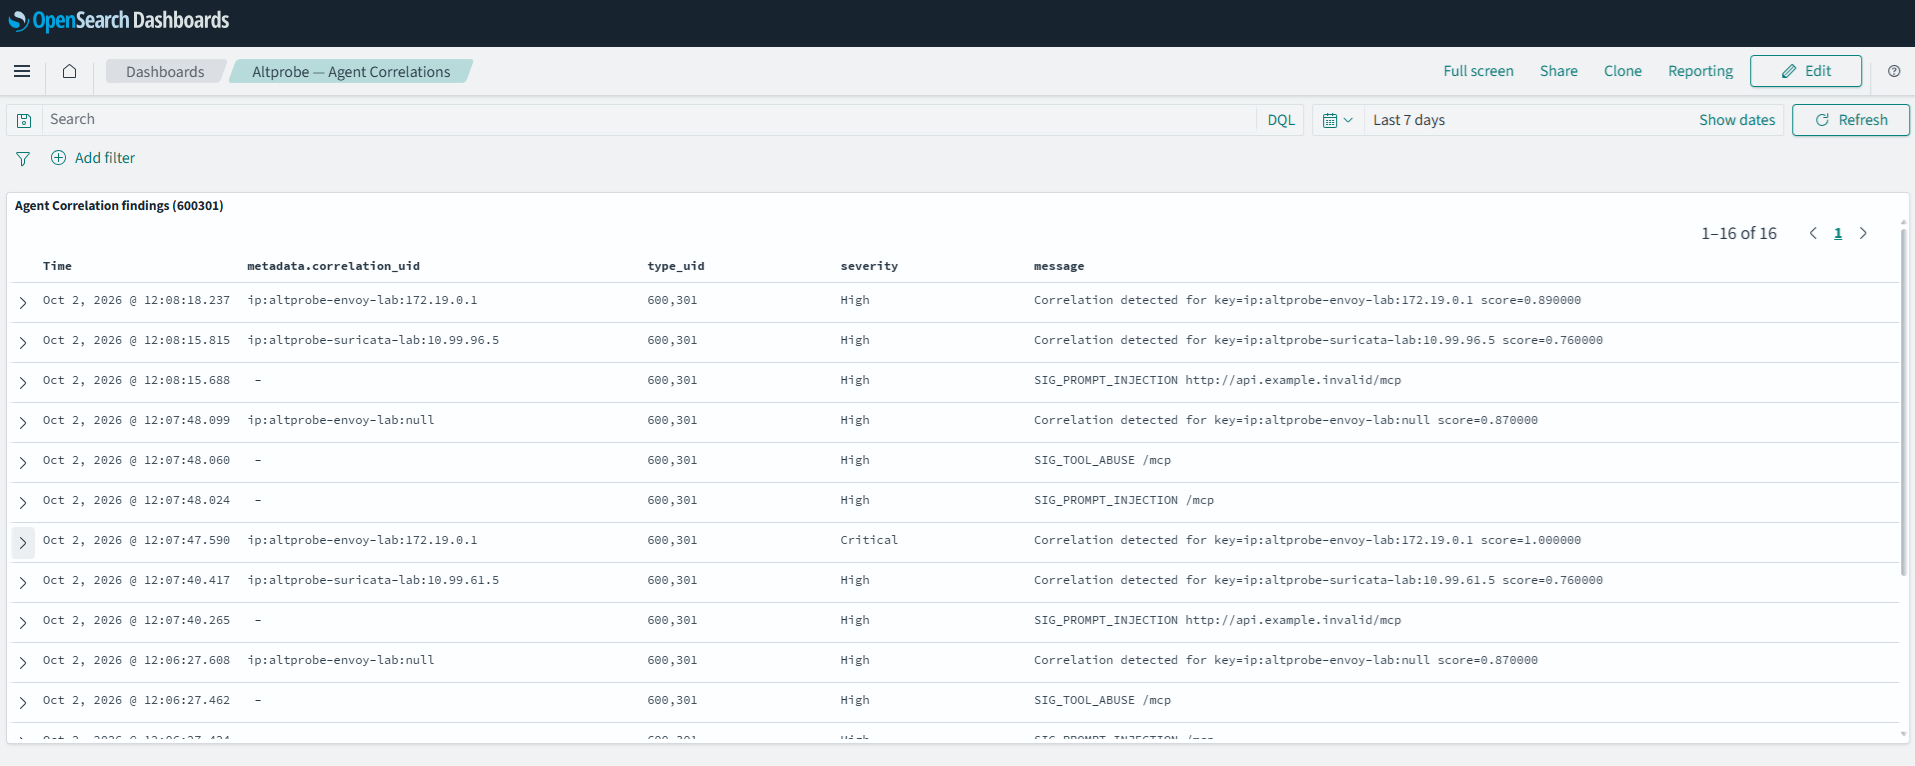
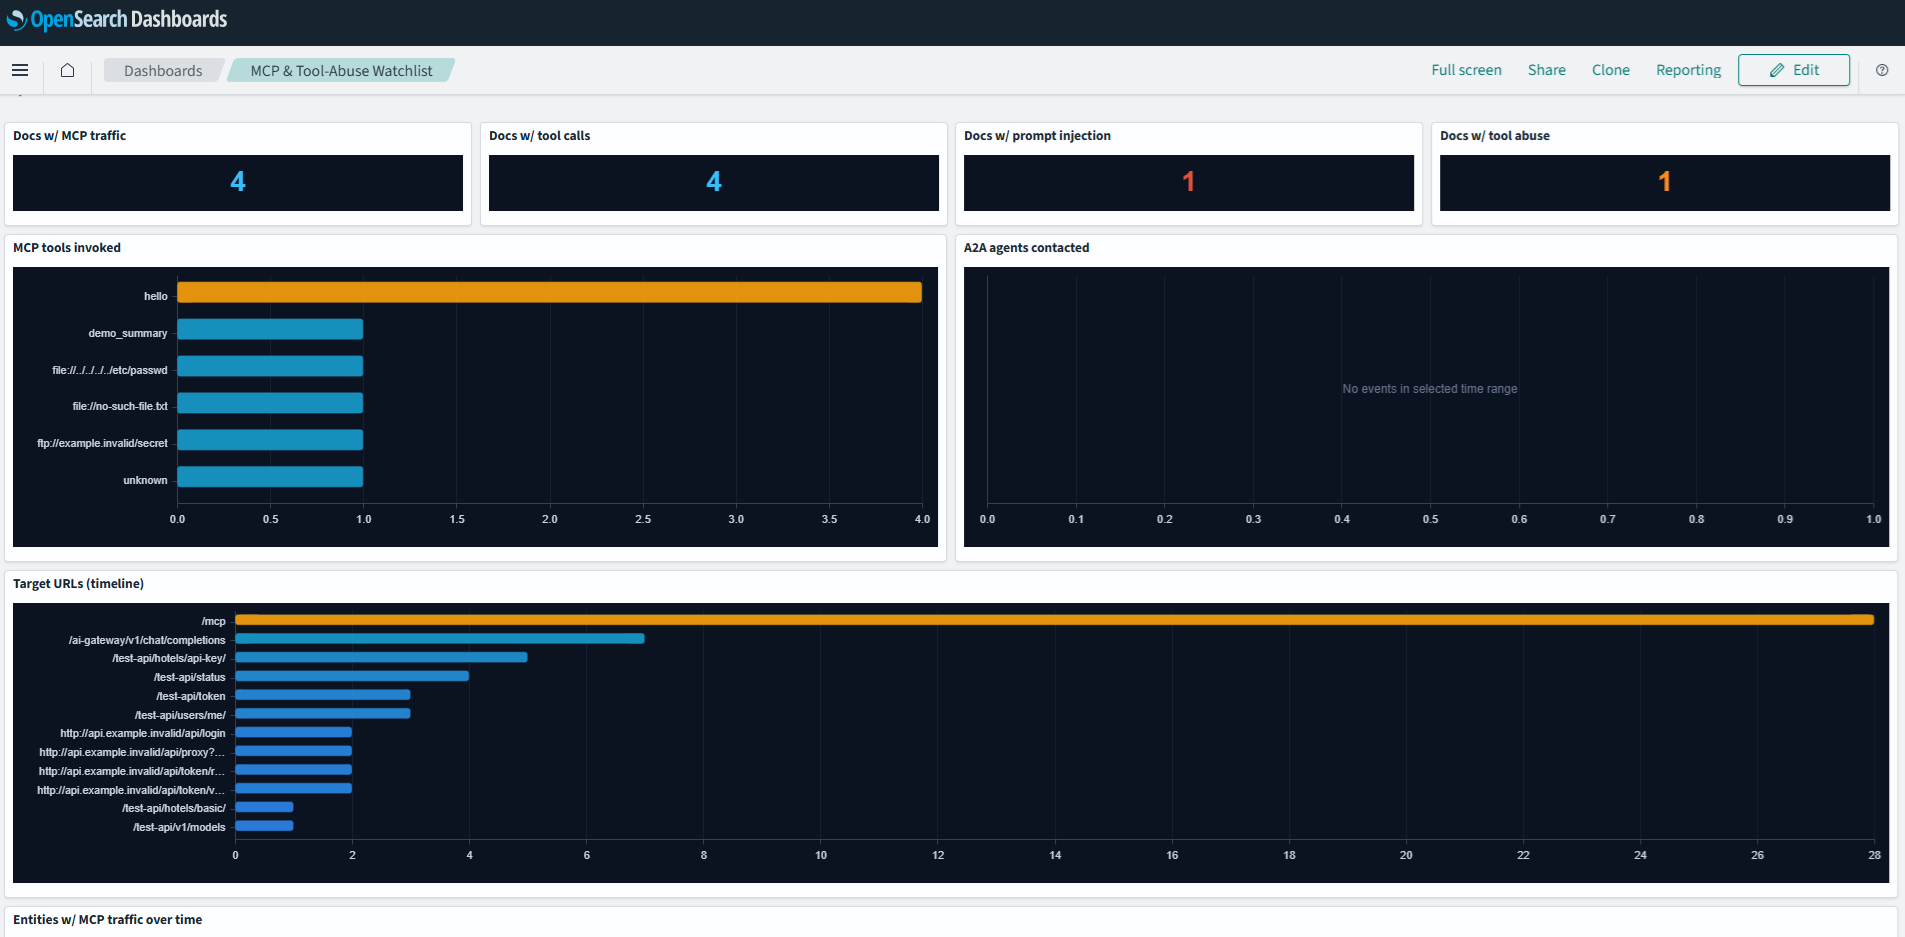
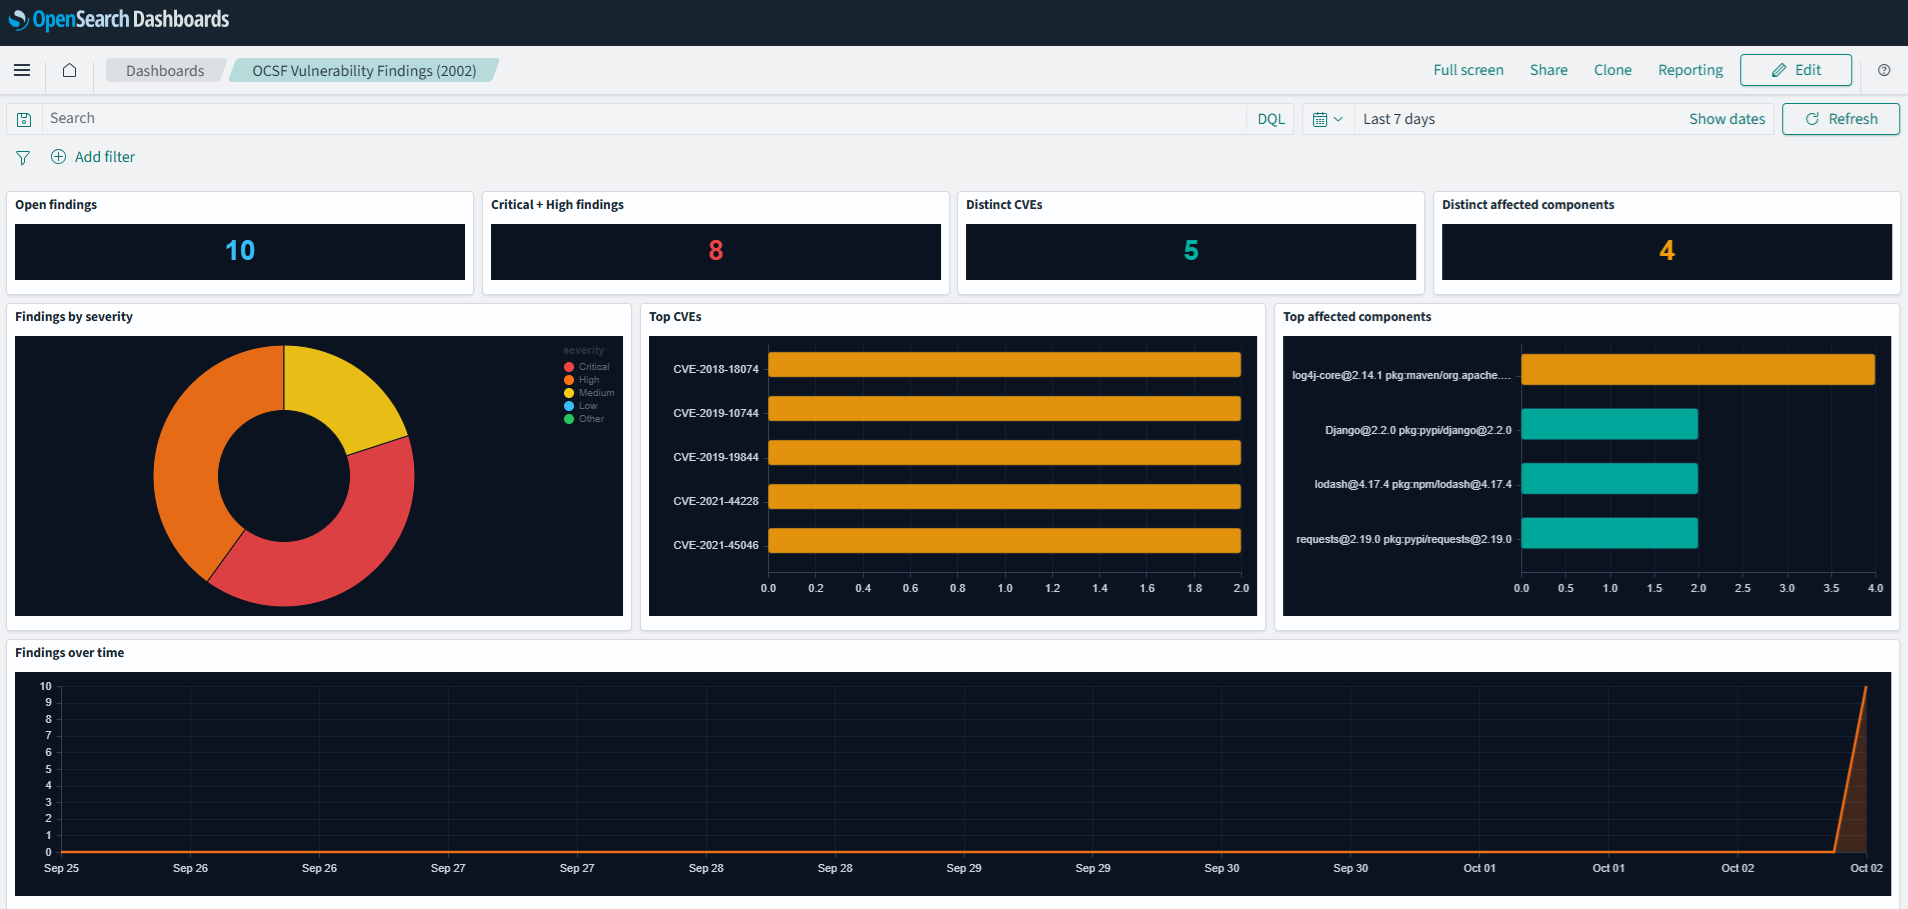
Search events in OpenSearch. Use Alertflex to investigate traces and incidents, get AI explanations and manage access.
Altprobe collects data on MCP services, tools and agent calls through your gateway.
Set a trigger for an event that matters. When it matches, a trace is captured for investigation.
AI Assistant helps you investigate an incident or trace and explains what happened in plain language.
Restrict access when needed. View decisions and their history in the console.
Monitoring and access management can be enabled separately. Access changes take effect when settings refresh.
Choose your gateway and start with a ready-to-run test lab.




See how it works with test data. Then connect your own services.
MCP inventory, event collection and OpenSearch reports. No Alertflex account is needed to run a test lab.
git clone https://github.com/olegzhr/altprobe.gitMCP services and their connections, incidents, traces and access management — in one Alertflex console.
Together, we'll find a deployment approach that fits your services and goals.
A quick guide to capabilities and getting started.
More questions?Altprobe, integrations and test labs are free under Apache-2.0. Alertflex deployment and support are discussed separately.
See MCP services, their tools and agent calls to MCP, API and A2A services. The gateway identifies agents by an access key or mTLS.
An incident is a detected anomaly in an agent's interaction with an MCP, API or A2A service — such as a suspicious tool call or an unusual sequence of requests. It highlights activity that needs review.
Set a trigger — a condition for capturing related events. Review the resulting trace yourself or investigate it with AI Assistant.
Allow or block access in the console. Gateways apply those decisions. Event analysis does not undo calls that have already completed.
Deploy Alertflex in your own environment and keep control of your data. You choose whether to use AI Assistant and which model to connect — local or external. Before AI analysis, the system masks detected personal data.
Run a ready-to-use test lab. Then pilot it with your own traffic — we'll help you choose where to start.
Tell us what you want to see and control. Together, we'll decide where to start.